Investing in mutual funds can feel confusing for many new investors. Returns look attractive on paper, but every return comes with a level of risk. Some funds grow steadily. Some funds move sharply up and down. Some funds take far more risk than others to deliver the same return.
Because of this, it becomes difficult to judge which fund is truly better.
This is where the Sharpe ratio in mutual funds becomes extremely useful. It is one of the simplest tools that tells you whether the return you are getting is worth the risk you are taking. You do not need vast finance knowledge or complex formulas to understand it. Once you get the basics, it becomes a very helpful indicator for choosing the right fund.
In this article, we cover the meaning, formula, calculation method, interpretation, and practical uses of the Sharpe ratio.
What is Sharpe Ratio in Mutual Funds?
The Sharpe ratio is a measure that compares the return of a mutual fund with the risk the fund takes to generate that return. It answers one basic question:
“How much return did the fund give for every unit of risk taken?”
If the Sharpe ratio value is high, the fund delivered better returns for the level of risk taken. If the Sharpe ratio value is low, the fund was either simply too volatile or it did not generate strong enough returns relative to the risk undertaken.
Imagine two mutual funds: Fund A and Fund B.
Both earn 12% returns in a year. At first glance, they look equally good. But their behaviour throughout the year is very different.
Fund A: Steady and Predictable
- It grows slowly through the year.
- It does not show sharp jumps.
- It avoids deep drops.
- The overall movement feels steady.
Fund B: Choppy and Stressful
- Some months show big gains.
- Other months show heavy losses.
- The value jumps around often.
- The experience feels stressful.
Since both funds delivered 12% return, at a glance you may believe that both funds are equal as their final numbers match. But one fund clearly managed risk better.
To directly compare these funds, we need a number that reflects both return and risk simultaneously. This is exactly why we use the Sharpe ratio in mutual funds – to understand how much risk each fund took to earn its return.
Simple put,
Higher Sharpe ratio value = better risk-adjusted performance
Lower Sharpe ratio value = more risk taken for each unit of return
Using this idea, the Sharpe ratio helps compare Fund A and Fund B even though they have the same return, visualising a gap that raw returns could not capture. This gives the investor a simple way to answer:
- Which fund used risk more efficiently?
- Which fund rewarded the investor without extreme volatility?
- Which fund managed the journey well, not just the destination?
Sharpe ratio hence converts the fund’s “journey” into a single number.
Understanding Sharpe Ratio Calculation
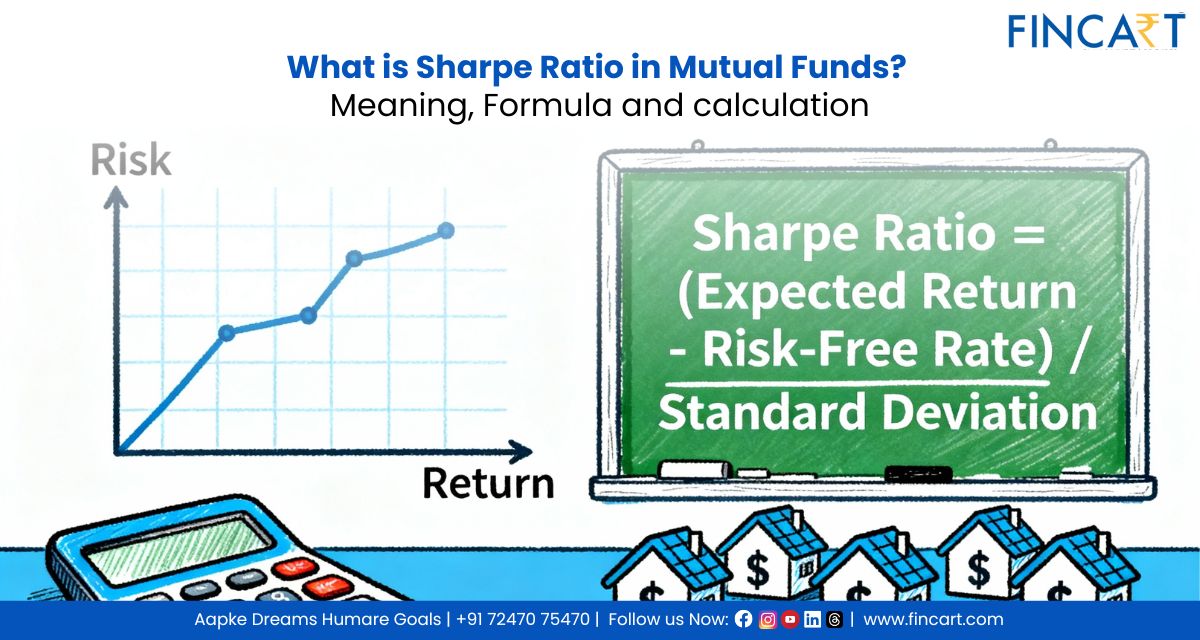
Sharpe ratio in mutual funds is given by the formula:
Sharpe Ratio = (Fund Return − Risk-free Return) ÷ Standard Deviation
Fund Return
This is the return given by the mutual fund for which you are calculating the Sharpe ratio, over a particular time period. Sharpe ratio is typically calculated for the long term, like at least 1 year.
Risk-Free Return
This is the return you would get without taking any risk. For example, money kept in government treasury bills or fixed deposits is considered almost risk-free.
- In India, the risk-free rate is typically represented by the yield on the Government of India’s 10 year G-Sec (Government Security) bond, as these are considered the safest investment with minimal default risk, serving as a baseline for other investments. While a precise current number isn’t static, it’s around the 7% mark.
The Sharpe Ratio subtracts this from the fund return because it only wants to measure the extra reward you get for taking market risk.
Standard Deviation (Risk)
Standard deviation measures the volatility, i.e. how much the fund’s returns move up and down. This is simply the risk associated with the fund.
The Sharpe ratio divides the extra return by this risk number. This answers the question:
“How much reward did I get for the amount of ups and downs I experienced?”
How to Interpret Sharpe Ratio
The Sharpe ratio in mutual funds becomes useful only when its meaning is clear. The number itself may look small, but even a small change can signal a big difference in risk-adjusted performance. Here’s how to understand the Sharpe ratio value:
- Below 1: Signals that the fund is not giving enough return for the risk taken.
- Between 1 and 2: Generally seen as acceptable to good.
- Above 2: Considered very good, showing strong risk-adjusted performance.
- 3 and above: Viewed as excellent, but is extremely rare in mutual funds, especially over long periods. However, such a Sharpe ratio may appear in short snapshots during unusual market phases.
Two funds may show similar returns, but their Sharpe ratios can reveal which one delivers those returns in a more stable and efficient way. This makes the Sharpe ratio a useful guide for selecting funds that balance growth with optimally controlled risk, rather than chasing high returns without really understanding the volatility behind them.
Common Mistakes Investors Make with Sharpe Ratio
Many investors use the Sharpe ratio but misunderstand how it works. These mistakes can lead to wrong fund choices.
Common errors include:
- Checking only the latest ratio and ignoring older data.
- Reviewing the ratio for only one year instead of long-term trends.
- Comparing funds from different categories, such as equity and debt.
- Believing that a higher Sharpe ratio alone means a better fund.
- Using data from different time periods, which gives misleading results.
- Ignoring how market conditions change the ratio over time.
- Skipping proper guidance from a mutual fund consultant, which increases confusion.
Keeping these points in mind helps investors use the Sharpe ratio correctly and avoid false signals.
Limitations of Sharpe Ratio
Sharpe ratio is helpful, but like any other financial metric, it has its own limitations. It cannot judge every part of a fund’s performance.
Key limitations include:
- It relies only on past data, which may not reflect future outcomes.
- It does not show how a fund behaves during extreme market events.
- It treats all ups and downs in returns the same, even when some volatility may be harmless.
- Different time periods can produce very different Sharpe values.
- It may favour funds with fewer short-term movements, even if they offer lower long-term growth.
- It should never be used alone. Investors need other tools like portfolio allocation checks, category comparisons, and consistency analysis.
Knowing these limits helps investors use the Sharpe ratio in mutual funds wisely instead of
depending on it blindly.
When Should You Use the Sharpe Ratio?
Sharpe ratio becomes powerful when used in the right situations. It helps investors clearly quantify and understand whether the returns justify the level of risk.
It is most useful:
- When comparing two similar funds in the same category.
- When checking how stable a fund’s performance has been over time.
- When reviewing long-term results instead of short-term spikes.
- When building a portfolio and needing a measure of risk efficiency.
- When evaluating overall balance in a multi-fund portfolio.
Sharpe ratio in mutual funds offers clarity in these situations by linking return and volatility in one number.
Conclusion
Sharpe ratio connects return with risk in a simple way. It helps investors avoid chasing high returns without understanding the volatility behind them. When used correctly, the Sharpe ratio in mutual funds supports smarter decision making and better portfolio choices.
It is not perfect, but it is an excellent starting point for anyone who wants to balance growth and stability. Investors who combine the Sharpe ratio with long-term data, category research, and advisor support make more confident investment decisions.
FAQs for Sharpe Ratio
Q: What is the Sharpe ratio in mutual funds in simple terms?
A: It shows how much return a fund gives for the level of risk it takes. A higher value means the fund manages risk better while delivering returns.
Q: Does a higher Sharpe ratio mean the fund is safer?
A: Not exactly. It means the fund is more efficient with risk, not risk-free. All market-linked funds carry some level of uncertainty.
Q: Can the Sharpe ratio change over time?
A: Yes. It changes with returns, market movements, and fund volatility. This is why long-term analysis works better than looking at only one year.
Q: Can the Sharpe ratio be used across all fund categories?
A: No. It works best when comparing funds within the same category. Comparing equity with debt, or hybrid with sector funds, can give misleading signals.
Q: Where can investors find the Sharpe ratio for mutual funds?
A: Sharpe ratio is available on most publicly accessible fund research platforms. Websites like AMC fund pages, popular investment apps, and data portals usually show it under the fund’s “Risk Measures” or “Performance” section.